We change our body chemistry every time we eat. In fact, diet is more powerful in preventing common diseases than either drugs or medical care. Learning about the glycemic index will help you reduce and prevent inflammation, stay slim, and reduce your risk of chronic diseases.
Glycemic Index 101
A few decades ago, all we knew was to eat less simple carbs and more complex carbs.
We now know this advice was too simplistic. Our bodies respond differently to the many types of complex carbohydrates.
The glycemic index is a more accurate guide to carbohydrates and other foods. Foods are given a number depending on how much they raise your blood sugar level. High-glycemic foods make your blood sugar level shoot up. Low-glycemic foods keep your blood sugar relatively stable. Foods lie along the spectrum from low to high-glycemic with numbers from 0 to 100.
How Your Body Reacts to High Glycemic Foods
Let’s dig into some biochemistry.
Here’s what happens when you have some high-glycemic food like white bread. First, your blood glucose levels shoot up as your body breaks down the white bread. The β-cells in your pancreas are triggered to action by the spiking blood glucose and work quickly to secrete insulin. High amounts of insulin are released and your blood glucose levels drop sharply. Your blood glucose levels get on the biological equivalent of a roller coaster. Compare that to how your body responds to a low-glycemic meal. Instead of spikes in blood glucose and insulin levels, your body only experiences a gradual increase in blood glucose and the pancreatic cells don’t have to work furiously to produce the insulin you need. You still with me? Here are some long-term effects of high-glycemic foods.
The Negative Effects of High-Glycemic Foods
1. Your risk of diabetes increases
If your pancreas constantly works overtime to produce enough insulin, it will fail. If your pancreas can’t produce enough insulin after each meal, your risk of type 2 diabetes increases.
Here are some common foods linked to diabetes: white bread, breakfast cereals – many of them claim to be whole-grain although they aren’t, white potatoes, corn, soda[link to soda post], and other sweetened drinks.
2. Your risk of cardiovascular disease also rises
We now know eating high-glycemic foods is linked to increased serum triglyceride and lower HDL (‘good’) cholesterol. Both increase your risk of cardiovascular disease.
3. Obesity becomes a problem
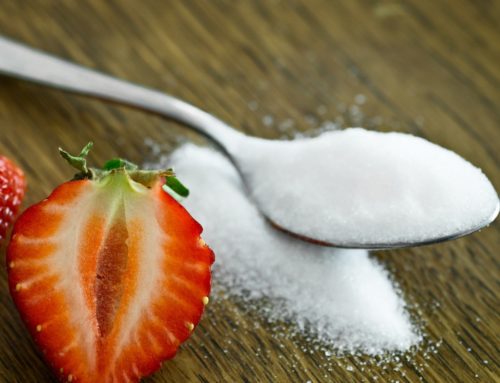
Your blood sugar level is tightly linked to how much you feel like eating. A lot of food cravings are caused by low blood sugar. Sugar and foods that quickly break down into sugar also make you tired, irritable, and inflamed. Also, if your blood sugar falls sharply, you’ll likely start munching. Let’s go back to what happens to your blood sugar level after a high-glycemic meal. Your blood sugar level shoots up as your body breaks the food down, then plunges when the pancreas releases insulin. Your body craves food when your blood sugar is low and signals you to eat again.
The cycle repeats. Your blood sugar shoots back up. Insulin is released. Your blood sugar drops. Once you get on this biochemical roller coaster, it takes a while before you can get off. Each time this cycle repeats, you consume more calories.
The Nitty-Gritty of the Glycemic Index and Glycemic Load
Here’s how to decipher glycemic index readings:
| Category | Glycemic index |
| Low GI | 1-55 |
| Medium GI | 56-69 |
| High GI | 70 and higher |
Stick to foods from the low GI category and eat some foods from the medium GI category. Avoid high GI foods.
You’ll hear the term ‘glycemic index’ more often, but sometimes you’ll hear about a food’s ‘glycemic load’ as well.
Which measure should you use? Here’s the short answer: the glycemic index is used more often and is generally a good guide. The glycemic load gives you a better picture of how much a food will make your blood sugar level rise, so use that if you have it.
Here’s how to decipher glycemic load readings:
| Category | Glycemic load |
| Low GL | 1-10 |
| Medium GL | 11-19 |
| High GL: | 20 and higher |
More Than the Glycemic Index
The glycemic index is just one of the factors to consider when planning your meals. Make sure you consider a food’s nutrients, vitamins, and calories as well. For example, Gatorade has about the same glycemic index as watermelon. That definitely doesn’t mean they’re both good for you. Watermelon has far more nutrients than any sugary energy drink.
Also, lots of healthy foods may not be on a glycemic index list. Just because you can’t find a food on a list doesn’t mean it’s unhealthy.
Here’s How to Eat a Low-Glycemic Diet
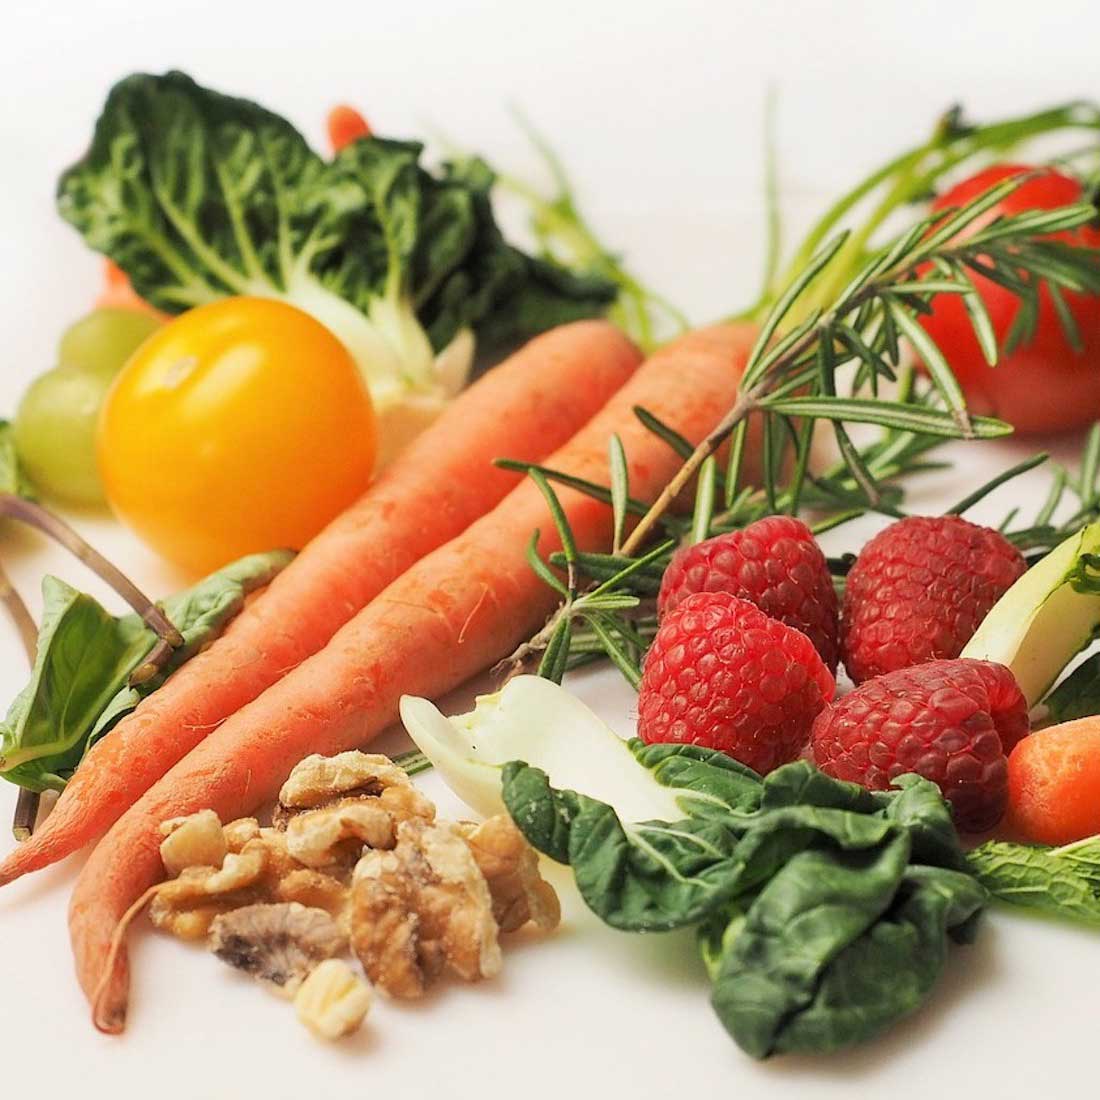
Eat more whole-grain foods. Have some steel-cut oats in the morning with blueberries and almond butter. For a snack, stay away from the cookies and grab some nuts and dried fruit instead. Definitely avoid the soda. At mealtimes, try grains like brown rice, buckwheat, and quinoa. Avoid white bread and eat less starchy foods such as potatoes and corn.
Table of Glycemic Index and Load of Foods
Check out the glycemic index of some of the most common foods. List courtesy of Harvard Health Publications.
| FOOD | Glycemic index (glucose = 100) | Serving size (grams) | Glycemic load per serving |
| BAKERY PRODUCTS AND BREADS | |||
| Banana cake, made with sugar | 47 | 60 | 14 |
| Banana cake, made without sugar | 55 | 60 | 12 |
| Sponge cake, plain | 46 | 63 | 17 |
| Vanilla cake made from packet mix with vanilla frosting (Betty Crocker) | 42 | 111 | 24 |
| Apple, made with sugar | 44 | 60 | 13 |
| Apple, made without sugar | 48 | 60 | 9 |
| Waffles, Aunt Jemima (Quaker Oats) | 76 | 35 | 10 |
| Bagel, white, frozen | 72 | 70 | 25 |
| Baguette, white, plain | 95 | 30 | 15 |
| Coarse barley bread, 75-80% kernels, average | 34 | 30 | 7 |
| Hamburger bun | 61 | 30 | 9 |
| Kaiser roll | 73 | 30 | 12 |
| Pumpernickel bread | 56 | 30 | 7 |
| 50% cracked wheat kernel bread | 58 | 30 | 12 |
| White wheat flour bread | 71 | 30 | 10 |
| Wonder bread, average | 73 | 30 | 10 |
| Whole wheat bread, average | 71 | 30 | 9 |
| 100% Whole Grain⢠bread (Natural Ovens) | 51 | 30 | 7 |
| Pita bread, white | 68 | 30 | 10 |
| Corn tortilla | 52 | 50 | 12 |
| Wheat tortilla | 30 | 50 | 8 |
| BEVERAGES | |||
| Coca Cola, average | 63 | 250 mL | 16 |
| Fanta, orange soft drink | 68 | 250 mL | 23 |
| Lucozade, original (sparkling glucose drink) | 95 | 250 mL | 40 |
| Apple juice, unsweetened, average | 44 | 250 mL | 30 |
| Cranberry juice cocktail (Ocean Spray) | 68 | 250 mL | 24 |
| Gatorade | 78 | 250 mL | 12 |
| Orange juice, unsweetened | 50 | 250 mL | 12 |
| Tomato juice, canned | 38 | 250 mL | 4 |
| BREAKFAST CEREALS AND RELATED PRODUCTS | |||
| All-Bran, average | 55 | 30 | 12 |
| Coco Pops, average | 77 | 30 | 20 |
| Cornflakes, average | 93 | 30 | 23 |
| Cream of Wheat (Nabisco) | 66 | 250 | 17 |
| Cream of Wheat, Instant (Nabisco) | 74 | 250 | 22 |
| Grapenuts, average | 75 | 30 | 16 |
| Muesli, average | 66 | 30 | 16 |
| Oatmeal, average | 55 | 250 | 13 |
| Instant oatmeal, average | 83 | 250 | 30 |
| Puffed wheat, average | 80 | 30 | 17 |
| Raisin Bran (Kellogg’s) | 61 | 30 | 12 |
| Special K (Kellogg’s) | 69 | 30 | 14 |
| GRAINS | |||
| Pearled barley, average | 28 | 150 | 12 |
| Sweet corn on the cob, average | 60 | 150 | 20 |
| Couscous, average | 65 | 150 | 9 |
| Quinoa | 53 | 150 | 13 |
| White rice, average | 89 | 150 | 43 |
| Quick cooking white basmati | 67 | 150 | 28 |
| Brown rice, average | 50 | 150 | 16 |
| Converted, white rice (Uncle Ben’s) | 38 | 150 | 14 |
| Whole wheat kernels, average | 30 | 50 | 11 |
| Bulgur, average | 48 | 150 | 12 |
| COOKIES AND CRACKERS | |||
| Graham crackers | 74 | 25 | 14 |
| Vanilla wafers | 77 | 25 | 14 |
| Shortbread | 64 | 25 | 10 |
| Rice cakes, average | 82 | 25 | 17 |
| Rye crisps, average | 64 | 25 | 11 |
| Soda crackers | 74 | 25 | 12 |
| DAIRY PRODUCTS AND ALTERNATIVES | |||
| Ice cream, regular | 57 | 50 | 6 |
| Ice cream, premium | 38 | 50 | 3 |
| Milk, full fat | 41 | 250mL | 5 |
| Milk, skim | 32 | 250 mL | 4 |
| Reduced-fat yogurt with fruit, average | 33 | 200 | 11 |
| FRUITS | |||
| Apple, average | 39 | 120 | 6 |
| Banana, ripe | 62 | 120 | 16 |
| Dates, dried | 42 | 60 | 18 |
| Grapefruit | 25 | 120 | 3 |
| Grapes, average | 59 | 120 | 11 |
| Orange, average | 40 | 120 | 4 |
| Peach, average | 42 | 120 | 5 |
| Peach, canned in light syrup | 40 | 120 | 5 |
| Pear, average | 38 | 120 | 4 |
| Pear, canned in pear juice | 43 | 120 | 5 |
| Prunes, pitted | 29 | 60 | 10 |
| Raisins | 64 | 60 | 28 |
| Watermelon | 72 | 120 | 4 |
| BEANS AND NUTS | |||
| Baked beans, average | 40 | 150 | 6 |
| Blackeye peas, average | 33 | 150 | 10 |
| Black beans | 30 | 150 | 7 |
| Chickpeas, average | 10 | 150 | 3 |
| Chickpeas, canned in brine | 38 | 150 | 9 |
| Navy beans, average | 31 | 150 | 9 |
| Kidney beans, average | 29 | 150 | 7 |
| Lentils, average | 29 | 150 | 5 |
| Soy beans, average | 15 | 150 | 1 |
| Cashews, salted | 27 | 50 | 3 |
| Peanuts, average | 7 | 50 | 0 |
| PASTA and NOODLES | |||
| Fettucini, average | 32 | 180 | 15 |
| Macaroni, average | 47 | 180 | 23 |
| Macaroni and Cheese (Kraft) | 64 | 180 | 32 |
| Spaghetti, white, boiled, average | 46 | 180 | 22 |
| Spaghetti, white, boiled 20 min, average | 58 | 180 | 26 |
| Spaghetti, wholemeal, boiled, average | 42 | 180 | 17 |
| SNACK FOODS | |||
| Corn chips, plain, salted, average | 42 | 50 | 11 |
| Fruit Roll-Ups | 99 | 30 | 24 |
| M & M’s, peanut | 33 | 30 | 6 |
| Microwave popcorn, plain, average | 55 | 20 | 6 |
| Potato chips, average | 51 | 50 | 12 |
| Pretzels, oven-baked | 83 | 30 | 16 |
| Snickers Bar | 51 | 60 | 18 |
| VEGETABLES | |||
| Green peas, average | 51 | 80 | 4 |
| Carrots, average | 35 | 80 | 2 |
| Parsnips | 52 | 80 | 4 |
| Baked russet potato, average | 111 | 150 | 33 |
| Boiled white potato, average | 82 | 150 | 21 |
| Instant mashed potato, average | 87 | 150 | 17 |
| Sweet potato, average | 70 | 150 | 22 |
| Yam, average | 54 | 150 | 20 |
| MISCELLANEOUS | |||
| Hummus (chickpea salad dip) | 6 | 30 | 0 |
| Chicken nuggets, frozen, reheated in microwave oven 5 min | 46 | 100 | 7 |
| Pizza, plain baked dough, served with parmesan cheese and tomato sauce | 80 | 100 | 22 |
| Pizza, Super Supreme (Pizza Hut) | 36 | 100 | 9 |
| Honey, average | 61 | 25 | 12 |
Chew on this
Keeping the glycemic index in mind when you pick foods will do a lot for you. It’ll even help you stay slim because you’ll be eating more fibre and less sugar.
Eating a low-glycemic diet will be easy. You don’t have to check a glycemic index list each time you eat. Remember the Michael Pollan food rule and you’ll be just fine: “Eat food (not processed). Not too much. Mostly plants.”
Eat well and live well!
Have you made the switch to a low-glycemic diet? Tell us about it in the comments!


